grammar
Source Link
tl.
  • 36
  • 3

This is a quick look at numbers to give an overview of probability changes.

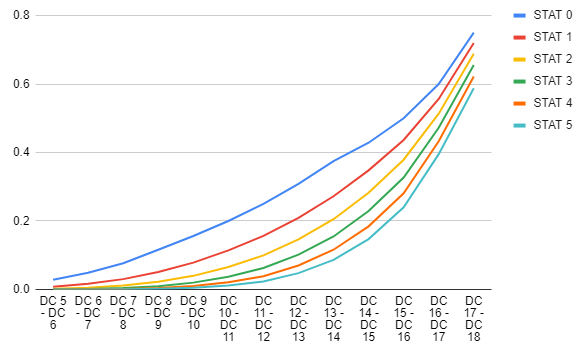
I've used AnyDice program to calculate chance of success for a range of STAT and DC values, then plotted those on a line graph.

Starting with just a success chance plots: enter image description here
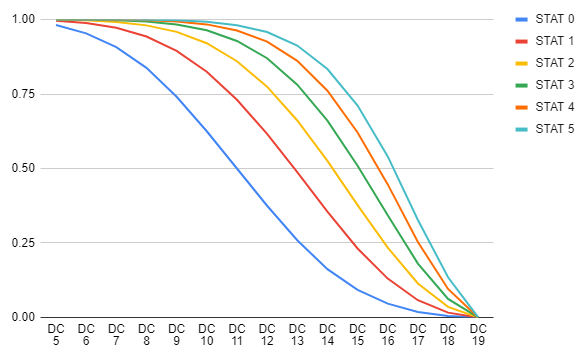
Nothing surprising - for very high/low success chances, the value of extra rolls is diminished, and, in general, each additional extra die is worth less than previous one. With DC 19 being impossible on 3d6, we can drop it from further consideration.

Second, let's look at the difference an additional die makes at different number of rolls. increase in success chance with an additional die
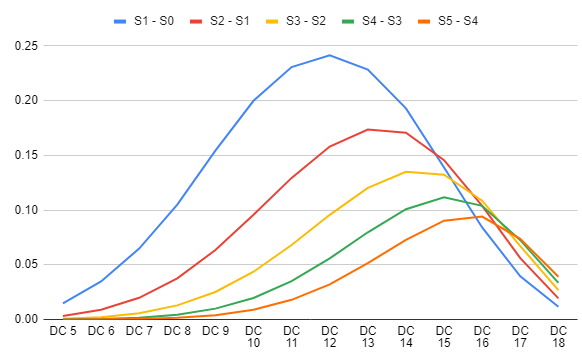
So regardless of number of dice, the additional die has the highest benefit around 50% success chance. For low and mid DCs, that benefit is higher the lower the original number of dice is. But the lower the number the dice, the steeper decline in benefit after 50% chance, leading to high base number of dice benefiting more from extra dice at high DCs.

We can look at similar graf representing the value of -1 DC (so that success chance differences remain positive). increase of success chance for DC decrease
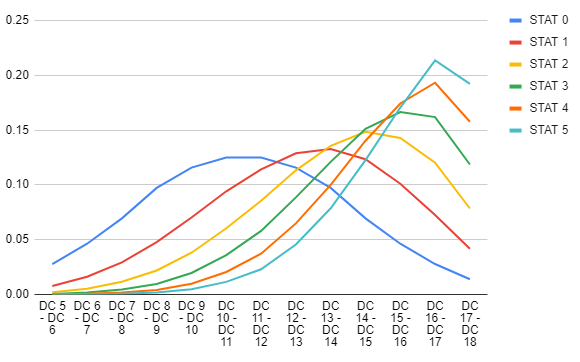
Similarly to additional die case, the effect of +/- 1 DC is most notable around 50% success chance before DC change. Other than that, I can't make any clear conclusions from this graph.

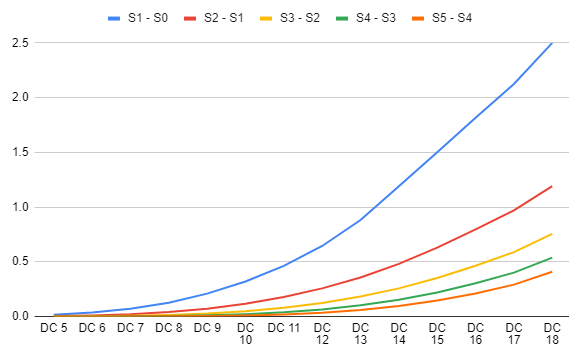
Relative versions of those 2 graphs (the increase in success chance / the base success chance) both show that relative value of additional die or -1DC grows higher with harder the check is (higher DC or lower dice number).

relative value of additional die

relative value of -1 DC

I've looked at some other values that felt like they could provide additional insight, like (P(DC=X)-P(DC=Y))*P(DC=X), but was unable to glean anything from them.

I was in doubt about posting this as it doesn't have a definitive answer, but having already gone through generating the graphs decided it is beneficial enough to deserve posting.
This is a quick look at numbers to give an overview of probability changes.

I've used AnyDice program to calculate chance of success for a range of STAT and DC values, then plotted those on a line graph.

Starting with just a success chance plots: enter image description here

Nothing surprising - for very high/low success chances, the value of extra rolls is diminished and, in general, each additional extra die is worth less than previous one. With DC 19 being impossible on 3d6, we can drop it from further consideration.

Second, let's look at the difference an additional die makes at different number of rolls. increase in success chance with an additional die

So regardless of number of dice, the additional die has the highest benefit around 50% success chance. For low and mid DCs, that benefit is higher the lower the original number of dice is. But the lower the number the dice, the steeper decline in benefit after 50% chance, leading to high base number of dice benefiting more from extra dice at high DCs.

We can look at similar graf representing the value of -1 DC (so that success chance differences remain positive). increase of success chance for DC decrease

Similarly to additional die case, the effect of +/- 1 DC is most notable around 50% success chance before DC change. Other than that, I can't make any clear conclusions from this graph.

Relative versions of those 2 graphs (the increase in success chance / the base success chance) both show that relative value of additional die or -1DC grows higher with harder the check is (higher DC or lower dice number).

relative value of additional die

relative value of -1 DC

I've looked at some other values that felt like they could provide additional insight, like (P(DC=X)-P(DC=Y))*P(DC=X), but was unable to glean anything from them.

I was in doubt about posting this as it doesn't have a definitive answer, but having already gone through generating the graphs decided it is beneficial enough to deserve posting.

deleted 1 character in body
Source Link
tl.
  • 36
  • 3

This is a quick look at numbers to give an overview of probability changes.

I've used AnyDice program to calculate chance of success for a range of STAT and DC values, then plotted those on a line graph.

Starting with just a success chance plots: enter image description here

Nothing surprising - for very high/low success chances, the value of extra rolls is diminished, and, in general, each additional extra die is worth less than previous one. With DC 19 being impossible on 3d6, we can drop it from further consideration.

Second, let's look at the difference an additional die makes at different number of rolls. increase in success chance with an additional die

So regardless of number of dice, the additional die has the highest benefit around 50% success chance. For low and mid DCs, that benefit is higher the lower the original number of dice is. But the lower the number the dice, the steeper decline in benefit after 50% chance, leading to high base number of dice benefiting more from extra dice at high DCs.

We can look at similar graf representing the value of -1 DC (so that success chance differences remain positive). increase of success chance for DC decrease

Similarly to additional die case, the effect of +/- 1 DC is most notable around 50% success chance before DC change. Other than that, I can't make any clear conclusions from this graph.

Relative versions of those 2 graphs (the increase in success chance / the base success chance) both show that relative value of additional die or -1DC grows higher with harder the check is (higher DC or lower dice number).

relative value of additional die

relative value of -1 DC

I've looked at some other values that felt like they could provide additional insight, like (P(DC=X)-P(DC=Y))*P(DC=X), but werewas unable to glean anything from them.

I was in doubt about posting this as it doesn't have a definitive answer, but having already gone through generating the graphs decided it is beneficial enough to deserve posting.

This is a quick look at numbers to give an overview of probability changes.

I've used AnyDice program to calculate chance of success for a range of STAT and DC values, then plotted those on a line graph.

Starting with just a success chance plots: enter image description here

Nothing surprising - for very high/low success chances, the value of extra rolls is diminished, and, in general, each additional extra die is worth less than previous one. With DC 19 being impossible on 3d6, we can drop it from further consideration.

Second, let's look at the difference an additional die makes at different number of rolls. increase in success chance with an additional die

So regardless of number of dice, the additional die has the highest benefit around 50% success chance. For low and mid DCs, that benefit is higher the lower the original number of dice is. But the lower the number the dice, the steeper decline in benefit after 50% chance, leading to high base number of dice benefiting more from extra dice at high DCs.

We can look at similar graf representing the value of -1 DC (so that success chance differences remain positive). increase of success chance for DC decrease

Similarly to additional die case, the effect of +/- 1 DC is most notable around 50% success chance before DC change. Other than that, I can't make any clear conclusions from this graph.

Relative versions of those 2 graphs (the increase in success chance / the base success chance) both show that relative value of additional die or -1DC grows higher with harder the check is (higher DC or lower dice number).

relative value of additional die

relative value of -1 DC

I've looked at some other values that felt like they could provide additional insight, like (P(DC=X)-P(DC=Y))*P(DC=X), but were unable to glean anything from them.

I was in doubt about posting this as it doesn't have a definitive answer, but having already gone through generating the graphs decided it is beneficial enough to deserve posting.

This is a quick look at numbers to give an overview of probability changes.

I've used AnyDice program to calculate chance of success for a range of STAT and DC values, then plotted those on a line graph.

Starting with just a success chance plots: enter image description here

Nothing surprising - for very high/low success chances, the value of extra rolls is diminished, and, in general, each additional extra die is worth less than previous one. With DC 19 being impossible on 3d6, we can drop it from further consideration.

Second, let's look at the difference an additional die makes at different number of rolls. increase in success chance with an additional die

So regardless of number of dice, the additional die has the highest benefit around 50% success chance. For low and mid DCs, that benefit is higher the lower the original number of dice is. But the lower the number the dice, the steeper decline in benefit after 50% chance, leading to high base number of dice benefiting more from extra dice at high DCs.

We can look at similar graf representing the value of -1 DC (so that success chance differences remain positive). increase of success chance for DC decrease

Similarly to additional die case, the effect of +/- 1 DC is most notable around 50% success chance before DC change. Other than that, I can't make any clear conclusions from this graph.

Relative versions of those 2 graphs (the increase in success chance / the base success chance) both show that relative value of additional die or -1DC grows higher with harder the check is (higher DC or lower dice number).

relative value of additional die

relative value of -1 DC

I've looked at some other values that felt like they could provide additional insight, like (P(DC=X)-P(DC=Y))*P(DC=X), but was unable to glean anything from them.

I was in doubt about posting this as it doesn't have a definitive answer, but having already gone through generating the graphs decided it is beneficial enough to deserve posting.

Source Link
tl.
  • 36
  • 3

This is a quick look at numbers to give an overview of probability changes.

I've used AnyDice program to calculate chance of success for a range of STAT and DC values, then plotted those on a line graph.

Starting with just a success chance plots: enter image description here

Nothing surprising - for very high/low success chances, the value of extra rolls is diminished, and, in general, each additional extra die is worth less than previous one. With DC 19 being impossible on 3d6, we can drop it from further consideration.

Second, let's look at the difference an additional die makes at different number of rolls. increase in success chance with an additional die

So regardless of number of dice, the additional die has the highest benefit around 50% success chance. For low and mid DCs, that benefit is higher the lower the original number of dice is. But the lower the number the dice, the steeper decline in benefit after 50% chance, leading to high base number of dice benefiting more from extra dice at high DCs.

We can look at similar graf representing the value of -1 DC (so that success chance differences remain positive). increase of success chance for DC decrease

Similarly to additional die case, the effect of +/- 1 DC is most notable around 50% success chance before DC change. Other than that, I can't make any clear conclusions from this graph.

Relative versions of those 2 graphs (the increase in success chance / the base success chance) both show that relative value of additional die or -1DC grows higher with harder the check is (higher DC or lower dice number).

relative value of additional die

relative value of -1 DC

I've looked at some other values that felt like they could provide additional insight, like (P(DC=X)-P(DC=Y))*P(DC=X), but were unable to glean anything from them.

I was in doubt about posting this as it doesn't have a definitive answer, but having already gone through generating the graphs decided it is beneficial enough to deserve posting.