About the same as taking the rounded up average, better early, worse later. Favors larger hit dice
When I'm trying to analyse a process which I can clearly describe as an alogrithm, but I'm having a hard time constructing the statistics I like to use Monte Carlo. The basic idea is to have a function which does the thing (using a digital die, ie. a pseudorandom number generator), run it many times recording the output, and then analysing that data as experimental results. That means the data will include some noise, we use high numbers to reduce that.
Using the python code at the end of the answer, we get the simulated result of 100000 characters with a d8 hit die and con mod of 0 levelling from 1 to 20 using the proposed houserule. Note that the last column is something else, we'll get back to that.
Omitting the 1st level as it's always static, and the 2nd level which will on average be the same, we get a slight increase over the average for just rolled. At 3rd level it is about 1 (average of 18 opposed to 17), but at level 20 it is only about 9.3 better. So while the initial expected increase is 5.5 going to 3rd level, it dips below 5 (the standard average levelling on a d8) when going to 10th.
But another possibility of this method is the ability to roll lower than your previous hit point total. Therefore, I also included a tracking of that, specifically how many times that happened (that last column in the code output). It averages to a 28.4% chance over the course of levelling from 1 to 20. That obviously includes some characters experiencing it twice or more (5 was the highest in my run), but doesn't include rolling the same hit point total as you had.
Running the same for the other (PC) hit dice sizes gives the tabulated values. Of note that d12 goes down to the rounded up average by 20th level, but would (slightly) more often experience a loss of hit points.
| Value |
d6 |
d8 |
d10 |
d12 |
| Avg at 20th level |
79.4 |
102.8 |
126.2 |
149.6 |
| Avg vanilla roll |
72.5 |
93.5 |
114.5 |
135.5 |
| Vanilla rounded avg |
82.0 |
103 |
124.0 |
145.0 |
| Gain at 3rd level |
4.2 |
5.5 |
6.7 |
8.0 |
| Gain at 20th level |
3.8 |
4.8 |
5.9 |
7.0 |
| Chance of decrease |
24.9% |
28.4% |
31.0% |
32.0% |
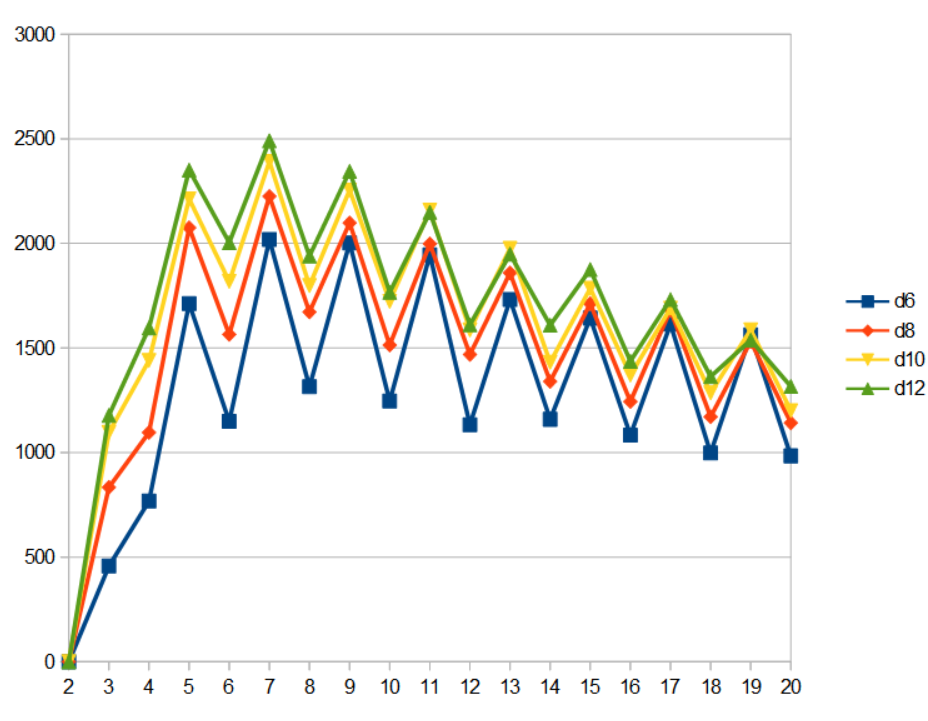
When diving into what level the decreases happen using a slightly different version of the function in the code, we find them biased towards Tier II and to odd levels. I would assume the latter to be an artefact of the .5 in dice's average compared to the integer results.

The y-axis is count of levels with a decrease out of 100000 runs for that die size.
import sys
import random

def d(n):
    return random.randint(1, n)

def rollNd(N, n):
    return list(map(d, [n]*N))

def rollhitpoints(die, con, f):
    decCounter = 0
    hp = die
    for level in range(2, 21):
        ohp = hp
        if hp < die + (die + 1)/2*(level-2) + con*level:
            hp = die + sum(rollNd(level-1, die)) + con*level
            if ohp > hp:
                decCounter += 1
        else:
            hp += d(die) + con
        f.write(str(hp)+'\t')
    f.write(str(decCounter)+'\n')

def rollnormalhitpoints(die, con, f):
    hp = die
    for level in range(2, 21):
        hp += d(die) + con
        f.write(str(hp)+'\t')
    f.write('\n')

IterCount = 100000
f = open('output/odohitpoints.txt', 'w+')
for i in range(IterCount):
    rollhitpoints(8, 0, f)
f.close()

