33
\$\begingroup\$

I'm designing a microRPG and need some help calculating probabilities so I can make an informed decision about how many coins to start with (controlling session duration and early-game frustration).

Here's the dice mechanic, simplified to just the situation I'm concerned about:

  • You start with 2 coins.
  • To resolve an action, roll 2d6.
  • If at least one die comes up UNDER your number of coins, you WIN and gain one coin.

How many rolls on average will it take to get 6 coins?

How does that change if the player starts with 3 coins instead of 2?

I assume Anydice is the default tool for this, but any answer that provides similar graphs/calculations would be equally appreciated.

\$\endgroup\$
2
  • \$\begingroup\$ I like your idea. Could you explain the system a bit more? Maybe using the forum, not the question. Thanks a lot. \$\endgroup\$
    – Masclins
    Commented May 17, 2016 at 7:08
  • 4
    \$\begingroup\$ @AlbertMasclans The Stack Exchange doesn't have a traditional-style forum, but you can find me in Role-playing Games Chat pretty consistently. \$\endgroup\$
    – BESW
    Commented May 17, 2016 at 7:16

6 Answers 6

52
\$\begingroup\$

Answers

Below are the expected number of steps/rolls to get to 6 coins:

  • Steps To Go From 2 Coins to 6 Coins = 7.52631
  • Steps To Go From 3 Coins to 6 Coins = 4.25833
  • Steps To Go From 4 Coins to 6 Coins = 2.45833
  • Steps To Go From 5 Coins to 6 Coins = 1.125

Solution

The best way to solve this problem in general is not Anydice, but with a tool called Markov chains. But let's start with the basic probabilities.

  • First, let's define your state. A state is the number of coins you have currently. So if you have 2 coins, you're in state 2, whereas if you have 3 coins, you are in state 3.

  • The probability of rolling under any number of a d6 is given by the following: \$\frac {x-1}{6}\$; for example, to roll under a 2, you need to roll a 1, which is a \$\frac 1 6\$ chance, or an \$\frac{x-1}{6} = \frac{2-1}{6} = \frac 1 6\$ chance

  • The reverse is true. To roll at least any number on a d6, it is "1 - Probability(rolling under that number)"; so to roll at least a 2, the probability is equal to not rolling under a 2. The formula is \$1-\frac{x-1}{6} = \frac{7-x}{6}\$

  • The probability to roll 2d6 and get at least one under a certain number, is equal to the probability of rolling 2d6 and rolling both with at least that number twice. That is, the only way to "fail" your roll is if both d6's are at least that target number. The math for this is "not Pr(roll at least that number) twice", and the formula is "1 - Pr(roll at least that number)2" which is equal to: \$1 - \left(\frac{7-x}{6}\right)^2\$

  • The probability to move from state x to state x+1 is the same as the probability of rolling 2d6 with at least one under x; put another way, the probability is the same as not rolling a least x twice.

Solution

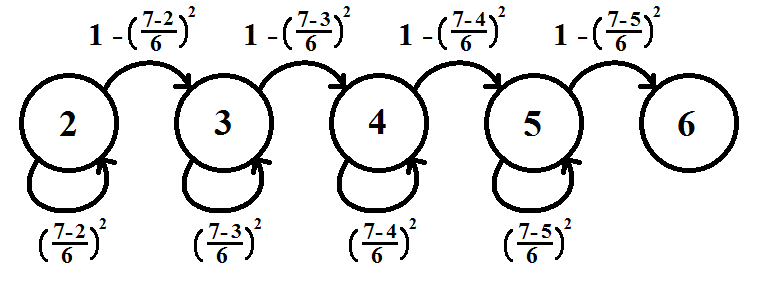
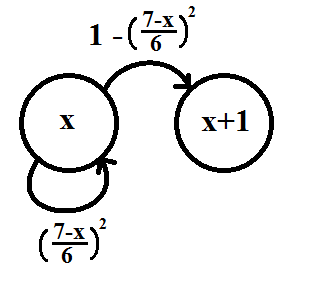
Hence you have the Markov chain:

Chain with variables

Arrows going from one circle to another represent the probability for jumping to the next state. The arrows from a circle going back to itself represent the probabilities for staying in the same state.

And since there are five states (2 through 6, there is no way to fall back to a previous state), this is the full chain:

Full chain

Now, from this chain, construct what is called a transition matrix which describes all the state change probabilities in mathematical form.

enter image description here

You can read up more about transition matrices online. Roughly, it charts the probability of going from a state on the left to the state on top. So going from state 2 back to state 2 is 0.6944, while the probability of it going to state 4 is 0, since you can only jump to one state at a time.

Here, we do some math to find the expected number of steps from any state to state 6. We do this by solving the equations that arise from the transition matrix. I won't explain them in much detail, I'll just show the final equations.

Let \$h(i,j)\$ be the expected number of steps from state i to state j.

\begin{align} h(2,6) &= 1 + (0.694) \times h(2,6) + (0.306) \times h(3,6) \\ h(3,6) &= 1 + (0.444) \times h(3,6) + (0.556) \times h(4,6) \\ h(4,6) &= 1 + (0.25) \times h(4,6) + (0.75) \times h(5,6) \\ h(5,6) &= 1 + (0.111) \times h(5,6) + (0.889) \times h(6,6) \\ h(6,6) &= 0 \end{align}

Answer

The problem is now reduced to a system of equations. Solving these, you get:

\begin{align} h(2,6) &= 7.52631 \\ h(3,6) &= 4.25833 \\ h(4,6) &= 2.45833 \\ h(5,6) &= 1.125 \\ h(6,6) &= 0 \end{align}

\$\endgroup\$
4
  • 20
    \$\begingroup\$ @nitsua60 I named my account after a mathematical concept when I created it at the Physics Stack years ago. I never thought back then I'd be using that same concept to solve problems at the RPG Stack years later. Haha \$\endgroup\$
    – user27327
    Commented May 17, 2016 at 12:43
  • 4
    \$\begingroup\$ @Yakk I suppose it looks overkill because of the multiple steps. However, I think it also looks more intuitive -- most will ignore the math anyway, the diagrams give a good idea about what's happening, beyond just numbers. Besides, I wanted to answer more than what the OP asked for \$\endgroup\$
    – user27327
    Commented May 17, 2016 at 15:01
  • \$\begingroup\$ Can you use this technique to figure the variance as well as the expectation? \$\endgroup\$
    – hobbs
    Commented May 17, 2016 at 18:37
  • \$\begingroup\$ @hobbs Yes, you can calculate the variances as well using this method. The expected values are already the answers given, so those are already done. \$\endgroup\$
    – user27327
    Commented May 18, 2016 at 0:55
12
\$\begingroup\$

You can do this analytically using geometric distributions. Anydice runs into problems with these because they are infinite and computer programs don't like infinite loops.

The probability distribution to get below the number of coins you currently have is a geometric distribution and we can use anydice to get the probabilities of each of these from n=2 to n=5:

n     p     1/p   sum(1/p)
2  .3056   3.272   7.530
3  .5556   1.800   4.258
4  .7500   1.333   2.458
5  .8888   1.125   1.125
           7.434

The mean is simply 1/p and the mean to go from 2 to 6 is, by the addition theorem of probability, simply the sum of each mean or 7.530.

It is worth noting that geometric distributions are memoryless which means that your chance of progressing on your next throw is independent of how many throws you have had. So, if you have 2 coins and throw you have a .3056 chance of getting 3 and a .6944 chance of still having 2 - if you still have 2 your average number of throws to get to 6 remains 7.530; if you have 3 it drops immediately to 4.258. With bad luck you can get a lot more then 7.434 (theoretically you might never get there).

\$\endgroup\$
6
  • \$\begingroup\$ This doesn't feel exactly correct (though it approximately is). I'm not sure though. It doesn't seem intuitive that you can add geometric means this way. Is this a formal theorem, by any chance? I'd like to read up on it and double check my own math. \$\endgroup\$
    – user27327
    Commented May 17, 2016 at 6:22
  • 1
    \$\begingroup\$ If you could edit the answer to lead with the results, in average rolls made, that'd be awesome. (I think I'm reading the table properly,, but I want to be sure I'm not interpreting it wrong. The Stack prefers answers that don't leave the last step as an exercise for the reader.) \$\endgroup\$
    – BESW
    Commented May 17, 2016 at 7:19
  • 3
    \$\begingroup\$ @markovchain Yes, you can add expected values that way. theorem: E[x+y]=E[x]+E[y], no matter what x and y are. \$\endgroup\$
    – Topquark
    Commented May 17, 2016 at 7:26
  • 2
    \$\begingroup\$ Specifically, p for n=5 seems fishy - maybe you used 1/36 instead of 4/36? (you need 4 or lower to get a coin, not 5 or lower) \$\endgroup\$ Commented May 17, 2016 at 10:04
  • 1
    \$\begingroup\$ Dale M has the logic right except for a math oopsy at n=5, which ought to be p=32/36=.888..., 1/p=1.125. Sum 3.273 + 1.800 + 1.333 + 1.125 = 7.531. \$\endgroup\$
    – RobertF
    Commented May 17, 2016 at 20:27
9
\$\begingroup\$

Here's some Python to lend some experimental results to the theoretical results others have added:

import random

def die_roll():
    dice = [random.randint(1, 6), random.randint(1, 6)]
    return dice

def play_game(starting_coins):
    coins = starting_coins
    rolls = 0
    while coins < 6:
        dice = die_roll()
        rolls += 1
        if dice[0] < coins or dice[1] < coins:
            coins += 1
    return rolls

turns = 0
rolls = 0

for i in range(100000):
    turns += 1
    rolls += play_game(2)

print float(rolls) / turns

Results:

  Starting coins | Average rolls (100K trials)  
  -------------- | ---------------------------  
  2              | 7.527408 
  3              | 4.25263 
  4              | 2.4624 
  5              | 1.12414 
\$\endgroup\$
3
  • 1
    \$\begingroup\$ Yep, I ran a Monte Carlo simulation as well (except my code isn't as elegant) and got the same results. \$\endgroup\$
    – RobertF
    Commented May 17, 2016 at 20:29
  • 1
    \$\begingroup\$ well, surely you didn't get the same results... \$\endgroup\$
    – nitsua60
    Commented May 18, 2016 at 1:46
  • \$\begingroup\$ @nitsua60 - Right, I should clarify - very, very close: < .05%. :) \$\endgroup\$
    – RobertF
    Commented May 18, 2016 at 14:30
5
\$\begingroup\$

With 2 coins, there's an \$\frac{11}{36}\$ chance that at least one die is a 1.

With 3 coins, there's a \$\frac{20}{36} = \frac59\$ chance that at least one die is a 1 or 2.

With 4 coins, there's a \$ \frac{27}{36} = \frac34\$ chance that at least one die is a 1-3.

With 5 coins, there's an \$ \frac{32}{36} = \frac89 \$ chance that at least one die is a 1-4.

The expected number of steps is just the inverse of the probability for each step.

so to go from 2 to 6 coins, it's \$ \frac{36}{11} + \frac95 + \frac43 + \frac98 = \frac{9941}{1320} \$ which is about 7.531

\$\endgroup\$
1
  • 3
    \$\begingroup\$ This is the most intuitive answer, to me. On the other hand, it presumes prior knowledge of the odds of rolling at least one X (i.e. where all the fractions come from), and doesn't address why you'd invert the probability. \$\endgroup\$
    – Bobson
    Commented May 19, 2016 at 3:47
5
\$\begingroup\$

About 7½ rolls

This is a pretty simple problem, because your system only stores a tiny bit of state—the number of coins.

Once we know the state, we know the behavior of your system from that point onward. Which means we can break your system down into simple problems, then add them up to find the average you want.

So we'll solve the simplest problem first: going from 5 to 6 coins.

Each time you try there is a \$1-(\frac{2}{6})^2\$ chance to transition (\$(\frac{2}{6})^2\$ is the chance for you not to transition—both dice land on a 5 or a 6, 2 chances in 6). As it happens, if you have an \$X\%\$ chance to do a transition, it takes on average \$\frac{100\%}{X\%}\$ times to do that transition.

So \$\frac{9}{8}\$ steps (or 1.125) on average.

Going from 4 to 5 takes \$\frac{1}{1-{(\frac{3}{6})}^2}\$ attempts on average, \$\frac{4}{3}\$ or 1.333...

And going from 4 to 6 takes 1.125 + 1.333… (the sum of the two above).

3 to 4 is \$\frac{1}{1-(\frac{4}{6})^2}\$ = \$\frac{9}{5}\$ or 1.8

2 to 3 is \$\frac{1}{1-(\frac{5}{6})^2}\$ is 3.27 or \$\frac{36}{11}\$.

So 3 to 6 takes \$\frac98 + \frac43 + \frac95 = \frac{511}{120}\$ or about 4.26 attempts on average.

And 2 to 6 takes \$\frac{511}{120} + \frac{36}{11} = \frac{9941}{1320} =\$ about 7.53 attempts.

\$\endgroup\$
4
\$\begingroup\$

As it happens, you can calculate this pretty accurately in AnyDice, it's just a bit tricky to do so efficiently.

A naïve implementation would look something like this:

function: DICE:d to reach TARGET:n from START:n {
  if START >= TARGET { result: 0 }
  result: 1 + [DICE to reach TARGET from START + ([lowest 1 of DICE] < START)]
}
set "maximum function depth" to 20
output [2d6 to reach 6 from 2]

Unfortunately, if you actually run this code, you'll notice that the resulting graph is obviously truncated at the maximum recursion limit — and worse, trying to increase that limit much above 30 or so will cause the code to time out. The problem is that the calculation is basically branching into two cases at each step, depending on whether the roll is over or under the threshold, and so the calculation time needed to reach n rolls deep grows exponentially as a function of n.

To get around that issue, we can make the code a little more clever:

function: DICE:d to roll below N:n {
  result: 1 + ([lowest 1 of DICE] >= N) * [DICE to roll below N]
}
function: DICE:d to reach TARGET:n from START:n {
  if START >= TARGET { result: 0 }
  result: [DICE to roll below START] + [DICE to reach TARGET from START+1]
}

set "maximum function depth" to 100
output [2d6 to reach 6 from 2]

With this method, we're first using a helper function to calculate the number of rolls needed to get one extra coin, and adding that to the number of rolls needed to reach the target after that. This way, the main function only needs to recurse 1 + TARGET - START times, and while the helper function does recurse deeper, there's no branching involved in the calculation, so the computation time only scales linearly with the number of rolls.

The only downside of this optimized program is that the effects of the (still finite) recursion limit are no longer so clearly visible: whereas the naïve version simply stops rolling dice entirely after n iterations (leading to an obvious peak at n rolls), the optimized version will, in effect, assume that the n-th roll at any given number of coins is always a success, thus subtly skewing the probabilities for events involving n or more rolls.

Fortunately, we can simply cut off that biased tail from the results, e.g. like this:

set "maximum function depth" to 102
output [minimum of 100 and [2d6 to reach 6 from 2]]

This way, all cases where reaching the target would take 100 rolls or more will simply be lumped under "100 rolls" in the output, just as with the naïve code. As long as the recursion depth limit is at least 2 levels higher than the cutoff (to account for the main function call and the inner [lowest 1 of D]), the probabilities below the cutoff will be accurate. (You can verify this by increasing the limit and observing that the results don't change.)

Anyway, the results will look like this (with a cutoff of 50 rolls):
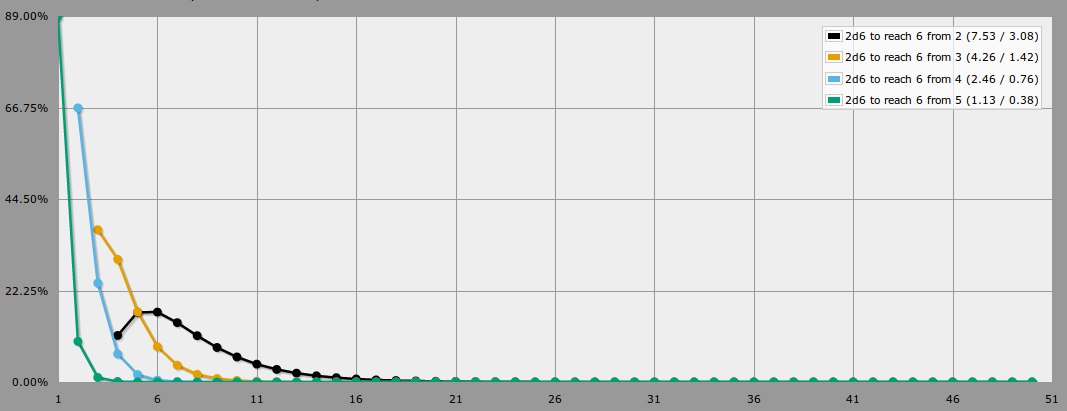
Number of d6 rolls needed to reach 6 from 2-5

You can easily increase the limit up to, say, 500 rolls, but then the interesting parts of the graph will be squeezed (even more) against the left edge of the screen. A cutoff of 25 to 50 rolls or so looks a lot more readable.

\$\endgroup\$

You must log in to answer this question.

Not the answer you're looking for? Browse other questions tagged .