5
\$\begingroup\$

My goal it to model a system where you roll xd10 and get the sum of the highest result you got (so "6, 3, 5, 5" becomes 6 and "4, 4, 2, 4" becomes 12), and then see how each extra die increases the odds ("is an extra die more valuable when starting at 3d10 as opposed to when starting at 5d10?")

I built off of this answer, modifying to calculate the sum of the instances of the highest number (well, the product of its count with its value, same thing) then divide by the amount of dice - getting, as a result, the 'average contribution of each die', or so I think. Looking at the graph view of the summary tab at the mean's curve should provide this answer for me.

function: sum highest in ROLL:s {
  MAX: 1@ROLL
  COUNT: ROLL = MAX
  result: COUNT * MAX
}
loop N over {2..10} {
  output [sum highest in Nd10]/N
} 

This is the result:

graph resulting from attemp

It doesn't look as I expected (I expected the first die to contribute more than the second, but further dice to start contributing more as they raise the chances of both a higher result and a higher count of it).

Which brings me to the question: was my expectation off-base, or does what I coded not do what I thought it would do?

\$\endgroup\$

4 Answers 4

3
\$\begingroup\$

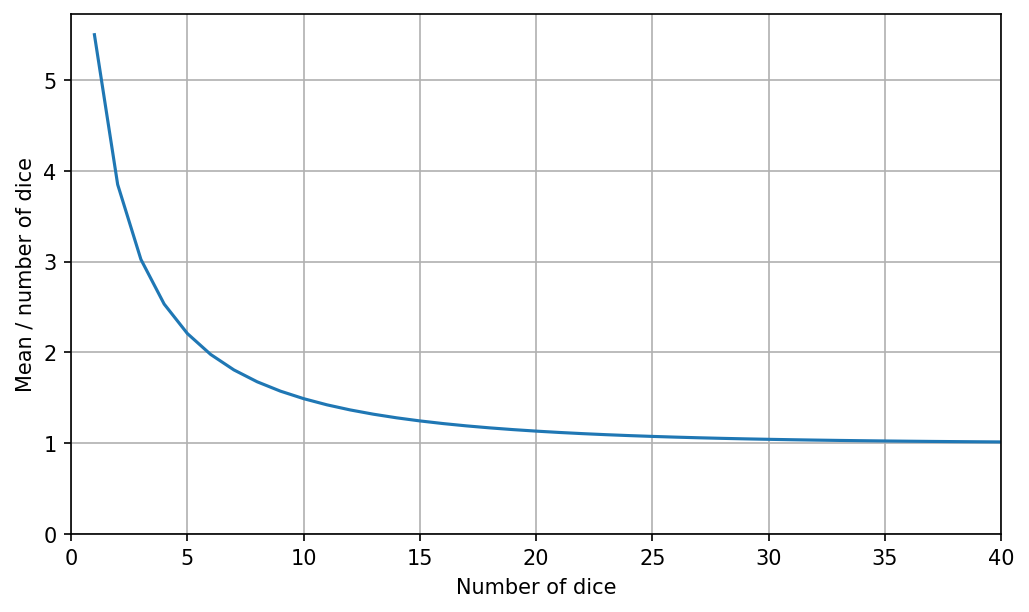
Results up to 40 dice

Normalized mean

This matches Ilmari Karonen's results.

I generated these results using my hdroller Python library. Computation time on my PC was under 0.2 seconds. The two key ideas for efficient yet flexible dice pool evaluation are:

  • Put the outer loop over the outcomes of the dice (e.g. 1-10 in this case). Don't iterate over the dice rolled.
  • Memoization.

In fact, Ilmari Karonen has mentioned both iterating over outcomes and memoization in the past, but I would venture to say that the full potential of these two ideas--especially combined--is greater than any of us imagined at first.

Here is a WIP explanation of the algorithm.

Marginal contribution to the mean sum

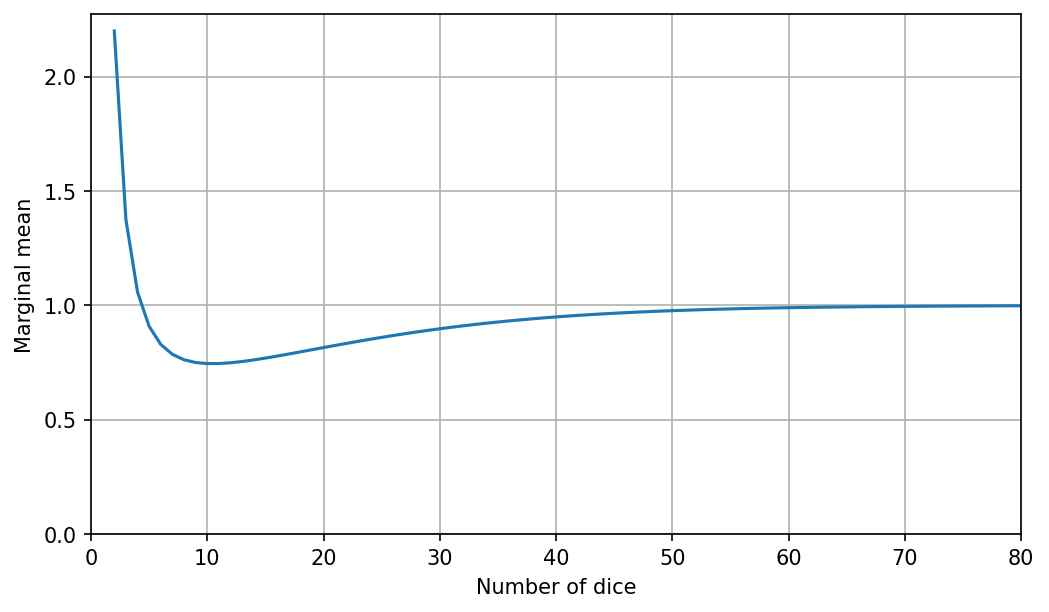
Here is each die's marginal contribution to the mean sum:

Marginal contribution to the mean sum

so Ilmari Karonen's conjecture about the behavior above 10 dice is exactly correct. For this plot, I doubled the maximum number of dice in order to emphasize the asymptotic behavior.

Note that the marginal contribution is not the same as the average contribution---taking the average dilutes the contribution of the marginal die across all previous dice.

Source code (specific to this problem)

I'm still refining the API so this is subject to change, but it should at least show the general idea.

from hdroller import *

# Phrase the pool evaluation as an iterative calculation
# given how many dice rolled each outcome in turn.
# The library takes care of the rest.
class SumOfHighest(EvalPool):
    def next_state(self, state, outcome, count):
        # If at least one die rolled this outcome,
        # or this is the first outcome...
        if state is None or count > 0:
            # Make the sum the result.
            return outcome * count
        else:
            # Otherwise, keep the old result.
            return state

    def direction(self, *_):
        # Get outcomes in ascending order.
        return 1

sum_of_highest = SumOfHighest()

max_dice = 40

x = list(range(1, max_dice+1))
y = []

for num_dice in x:
    y.append(d10.pool(num_dice).eval(sum_of_highest).mean() / num_dice)

# Plotting code...

Try it in your browser using a Starboard notebook.

\$\endgroup\$
4
  • 1
    \$\begingroup\$ Nice! I'm really looking forward to understanding the technique. I took a superficial look at hdroller to see if I could understand more about the context around EvalPool, but haven't yet grok'ed it. \$\endgroup\$
    – posita
    Commented Feb 13, 2022 at 14:38
  • \$\begingroup\$ Thanks! I threw together a crude explanation of the algorithm, though it still needs work. \$\endgroup\$ Commented Feb 14, 2022 at 2:24
  • \$\begingroup\$ Excellent, thank you! Is there a way to display marginals in anydice (cause, presumably, I'll have to run a few more simulations, and at the same time hopefully not enough of them to learn a new tool)? And, what exactly is it? (The difference of N from N-1, I assume?). And yea, this is vaguely what I wanted... except I was hoping for contracted and reverse behavior :P Still, really interesting and helpful! \$\endgroup\$ Commented Feb 14, 2022 at 12:06
  • 1
    \$\begingroup\$ @ThanosMaravel Yep, that is indeed what marginal means. Unfortunately AnyDice does not have any built-in functionality for this. \$\endgroup\$ Commented Feb 15, 2022 at 5:41
2
\$\begingroup\$

One obvious problem I see with your attempt is rounding errors. AnyDice uses integer math, and rounds the result of division towards zero*, so for example 9 / 5 in AnyDice equals 1, not 1.8 (which is not a number AnyDice can represent).

You can partly work around this issue by multiplying your numbers by some suitably large constant factor (say, 10 or 100 or 1000) before dividing them by N. Also, to make AnyDice round the result of division to nearest integer, instead of always down, you can replace A / B with (2*A + B) / (2*B).

(To be precise, because AnyDice rounds towards zero instead of always down, that formula only works for positive results. If either the dividend or the divisor may be negative, you'll need something slightly more complicated, as shown below. Also, there still an ambiguous case when the divisor is even and the remainder is exactly half of the divisor; my code below rounds away from zero in those cases, but other choices are also possible and justifiable.)

Putting those together, you'll get something like this:

function: sum highest in ROLL:s {
  MAX: 1@ROLL
  COUNT: ROLL = MAX
  result: COUNT * MAX
}
function: divide A:n by B:n and round to nearest {
  if A < 0 { result: -[divide -A by B and round to nearest] }
  if B < 0 { result: -[divide A by -B and round to nearest] }
  result: (2*A + B) / (2*B)
}
loop N over {2..10} {
  output [divide [sum highest in Nd10] * 1000 by N and round to nearest] named "[N]d10"
}

Of course, the results output by this code are all multiplied by 1000, so for example a result of 1667 really means 1.667, i.e. approximately 5 / 3.


If you only care about the average results, or about the general shape of the distributions instead of their exact value, there's another possible workaround that makes use of AnyDice's ability to work with probability distributions: rounding with dithering. Basically, the idea is to replace A / B with a function that rounds the result of the division up with probability p = R / B, where R is the remainder left after dividing A by B, and down with probability 1 − p, e.g. like this:

function: sum highest in ROLL:s {
  MAX: 1@ROLL
  COUNT: ROLL = MAX
  result: COUNT * MAX
}
function: divide A:n by B:n with dithering {
  if A < 0 { result: -[divide -A by B with dithering] }
  if B < 0 { result: -[divide A by -B with dithering] }
  Q: A / B
  R: A - Q * B
  result: Q + d{1:R, 0:B-R}
}
loop N over {2..10} {
  output [divide [sum highest in Nd10] by N with dithering] named "[N]d10"
}

Using this kind of dithering division will yield exactly correct averages with no rounding error** even without any multiply-by-1000 scaling tricks. However, the distributions of the actual rolled results will look "blurred", since e.g. the probability of rolling 7 / 2 = 3.5 will be spread evenly over the "3" and "4" bins in the chart. (The standard deviations in the summary view will also be off a bit, since the dithering introduces extra randomness and thus increases the variance of the results.)


*) The AnyDice documentation says "down" instead of "towards zero", but that appears to be an error in the documentation. The actual behavior is easy enough to verify.

**) Well, except for the very slight errors possibly resulting from the finite precision floating point math used by AnyDice to calculate probabilities.


I expected the first die to contribute more than the second, but further dice to start contributing more as they raise the chances of both a higher result and a higher count of it.

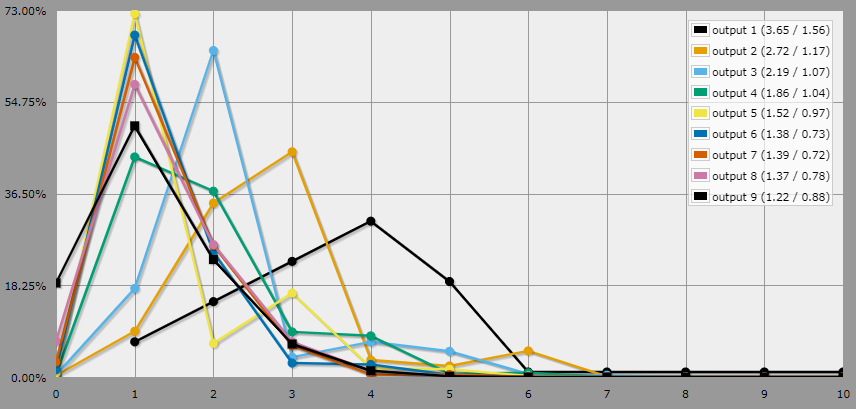
Looking at the results from the programs above, it seems that — even with corrected rounding — your intuition is indeed off: at least for the pool sizes AnyDice can handle, the more dice there already are in the pool, the less relative value a single extra die has.


One way of perhaps refining your intuition is to consider the limit of very large pools, where you're almost guaranteed to roll at least one 10 on nd10. Thus, your result is almost always 10 × k, where k is the number of your dice that rolled a 10.

The random number k above is binomially distributed, with an average of n / 10, where n is the number of dice in the pool. Thus, the average result of a roll of n dice is 10 × (n / 10) = n, and so adding one more die to the pool always just raises the average by one, while the average result divided by the number of dice stays the same. So in the limit of very large pools, the relative gain from one extra die, divided by the number of dice already in the pool, tends to zero!

Of course, for smaller pools, there's also a non-negligible change of rolling no tens at all, and thus adding more dice raises the probability of rolling a higher max value. The effects of this are more complicated to calculate, since raising the value of the highest roll is not always beneficial: a roll of (1, 5, 7, 7) → 14 is better than a roll of (1, 5, 7, 7, 10) → 10.


Based on experimenting with your code (specifically, removing the division entirely and varying the size of the pool and the number of sides on the dice) it seems that as the pool size increases starting from one die, there are (at least for large enough dice) three qualitatively different phases:

  1. At first, when the number of dice is very small compared to the number of sides on each die, doubles are unlikely (and double highest rolls even less likely) and thus the average result is mostly determined by the average of the highest number rolled. The first few additional dice each raise the average by more than 1, but each additional die raises the average by a smaller amount than the previous one.

  2. As the number of dice in the pool gets large enough, the average gain from each additional die drops below one. For 10-sided dice this happens at 4d10: the fourth die increases the average by 10.13 − 9.07 = 1.06, but the fifth only by 11.04 − 10.13 = 0.91.

  3. As the number of dice increases further, the gain from each additional die eventually reaches a minimum somewhere between 0 and 1 and then starts slowly rising again as the average result approaches the asymptote where, for large n, the average result from rolling n dice and taking the sum of the highest rolls simply equals n as described above.

    (For 10-sided dice the minimum gain per additional die seems to occur at 10d10, with the 10th die increasing the average by only 0.7456 points, compared to 0.7502 for the 9th die and 0.7457 points for the 11th. This is right at the limit of what AnyDice can calculate without timing out, but I'm confident that for larger pools the average gain from one extra die will indeed slowly rise and approach one asymptotically.)

Basically, when the number of dice rolled is much larger than the number of sides per die, the binomial approximation described above holds well and the average result is simply equal to the number of dice rolls. But for smaller numbers of dice there is a "bump" in the averages, caused by the fact that even rolls where none of the dice rolls the highest possible result can still score a decent number of points based on the highest number actually rolled (and any possible duplicates of it).

\$\endgroup\$
4
  • \$\begingroup\$ Interesting! So given enough dice (an extreme amount of them) the qualitative sections I was hoping for exist (a local minimum at non-minimum dice) but the 'past the minimum' section isn't sufficiently high. Plus, too many dice needed. Do I get it? \$\endgroup\$ Commented Feb 12, 2022 at 20:41
  • \$\begingroup\$ @ThanosMaravel: Kinda, yes. A local minimum for "change in average result from adding one die" does exist. I don't think there's a minimum for "change in average result divided by number of dice", though — that seems to be a monotone descending curve. \$\endgroup\$ Commented Feb 12, 2022 at 21:37
  • \$\begingroup\$ Wouldn't the two plot the same way (qualitatively, not quantitatively)? The average contribution per die is going to be adjusted higher for additions that contribute more and vice versa. Is there a scenario where the two conflict? What would the code be to display 'change in average result from adding this die'? \$\endgroup\$ Commented Feb 13, 2022 at 0:02
  • 1
    \$\begingroup\$ To use economic terms, the marginal is not the same as the average---taking the average dilutes the contribution of the marginal die across all previous dice. \$\endgroup\$ Commented Feb 13, 2022 at 4:30
2
\$\begingroup\$

I get a different result when I try to reproduce your described calculation using dyce¹:

from dyce import H, P

d10 = H(10)

def mechanic(nd10_roll):
    outcome_max = max(nd10_roll)
    # We are faithfully reproducing the approach here of (max * count). As alluded to
    # in the original question, we could have just as easily written something like:
    #   max_sum = sum(outcome for outcome in nd10_roll if outcome == outcome_max)
    count_max = sum(1 for outcome in nd10_roll if outcome == outcome_max)
    max_sum = outcome_max * count_max
    # Rounding is optional. We do it here solely for display readability.
    return round(max_sum / len(nd10_roll), 2)

results = {
  n: P.foreach(mechanic, nd10_roll=n@P(d10))
  for n in range(2, 7)
}

# ... see graph/binder for visualization of results

I've attached the anydyce² graphs below. You can see my attempt (and play around with it) in your browser: Try dyce [source]

That configuration of JupyterLite uses in-memory browser storage, so download any work you want to save.

There's a reasonable possibility the difference could be explained by:

  1. My not understanding your sentiment;
  2. My not getting my math right;
  3. AnyDice not doing what you think it's doing or want it to do; or
  4. Some combination of 1, 2, and 3.

That being said, my results look similar to @Ilmari Karonen's scaled up result from his answer. There are more efficient (and less readable) ways for dyce to arrive at those results, but you should be able to drive that implementation up to 10d10 (and possibly beyond) without too much of an issue. If you want to go higher, I can explore alternatives.


¹ dyce is my Python dice probability library.

² anydyce is my visualization layer for dyce meant as a rough stand-in for AnyDice.


Line Plot Burst Plot

\$\endgroup\$
1
  • \$\begingroup\$ Best I can tell, your intent matches mine. And, I think your results are in line with it too. However, you've graphed out the values, while my description is about the mean, which probably explains our inconsistency. \$\endgroup\$ Commented Feb 12, 2022 at 20:55
-3
\$\begingroup\$

You want this

function: sum highest in ROLL:s {
  result: [count 1@ROLL in ROLL]*1@ROLL
}
loop N over {2..5} {
  output [sum highest in Nd10]
} 

It gives you how many dice match the highest die in the pool (irrespective of what that is).

\$\endgroup\$
3
  • 1
    \$\begingroup\$ Nope, I really do in fact care about the value of the highest (since what I want is the sum of those matching dice). In a {5, 8, 8} result, the output should be 16 - 2 instances of 8! \$\endgroup\$ Commented Feb 12, 2022 at 13:56
  • \$\begingroup\$ That’s easy fixed - see edit \$\endgroup\$
    – Dale M
    Commented Feb 12, 2022 at 20:49
  • \$\begingroup\$ You have also forgone normalizing for pool size! Adding that in, the result seems consistent with mine, meaning in turn that my solution was probably what I hoped it is! \$\endgroup\$ Commented Feb 12, 2022 at 20:59

You must log in to answer this question.

Not the answer you're looking for? Browse other questions tagged .